
Sometimes common statistics (Wins, RBI, Runs, etc...) don't tell the entire story, or even a good portion of it.
Therefore, the purpose of the more advanced statistics is to fill in some of those blanks in the story. For instance, while good pitchers generally have a good ERA, ERA relies (a lot) on the fielders behind the pitcher. So when you want to evaluate a pitcher on solely what he was responsible for, we resort to pitching statistics that take defense out of the equation. One of those is FIP which stands for Fielding Independent Pitching.
FIP: Invented by Tangotiger, Fielding Independent Pitching is:
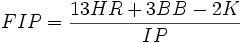
Followed by a league-specific factor which is usually around 3.2 to make FIP look like ERA, which is a number we can all understand. Whenever you see FIP just think ERA, and now you have a number that more accurately tells you how successful a pitcher was. For more FIP help, check out this primer.
While FIP helps measure all that a pitcher can control, it doesn't entirely take "luck" out of the equation.
For one thing, while pitchers can control how often they give up fly balls, they can't necessarily control how often those fly balls become home runs. This leads us to a modified/normalized version of FIP called:
xFIP: The league average for fly balls that become home runs is around 11%. xFIP is then like FIP just normalized for an average amount of fly balls becoming home runs. For example look at James Shields:
ERA
|
FIP
|
xFIP
|
FB%
|
HR/FB%
| |
2008
|
3.56
|
3.82
|
3.92
|
37.50%
|
9.80%
|
2009
|
4.14
|
4.02
|
3.92
|
37.20%
|
11.20%
|
2010
|
5.18
|
4.24
|
3.72
|
38.20%
|
13.80%
|
According to his xFIPs over the last three years, you can tell that James Shields has been pretty consistent. However, factors outside of his control have contributed to his fluctuating ERA. In 2008 when less fly balls became home runs, it looked like James Shields was an ace. The next year when an average amount of fly balls left the yard, James Shields seemed like a reliable starter. In 2010 when an abnormal amount of fly balls left the yard James Shields seemed like a scrub. Of course Shields hasn't been a scrub, he's just been unlucky, and the Rays know this because he's slotted as the #2 starter in the playoffs.
Furthermore, it is understood that pitchers have little control of batted balls hit inside the park (in addition to the ones that leave the park), leading us to another important statistic, Batting Average on Balls in Play,
BABIP:

It may sound counter-intuitive, but even the best pitchers in baseball have BABIPs that fluctuate year to year, often a lot. For example, in 1999 Pedro Martinez' BABIP was .343, and the following year it was .253. If Pedro Martinez during his prime couldn't control balls put in play off of him, I don't think anyone can. With that said, on average pitchers have a BABIP ~.300. Where that is helpful then, is looking for instances of luck. This year, Jonathan Sanchez has a 3.07 ERA and a BABIP of .262. Last year he had a 4.24 ERA and a BABIP of .290. Nothing else has changed either as he's essentially struck out and walked the same amount of batters. He has simply been lucky this year. In fact, as you might have guessed (now that you know this stuff), he has a similar FIP this year compared to last year (4.00/4.17).
It should also be noted that not all balls in play are created equal. Line drives have a better chance of becoming a hit, fly balls are easier to catch, ground balls find a hole more often than a bull hit in the air, and popups almost always get caught; all of which affect a pitcher's BABIP and in return, his performance. Also, while a fly ball has a better chance of becoming an out, it also has a better chance of becoming a homer. So, it should make sense then, that the best pitchers are the ones that can strike out a lot of guys (duh!) and can keep the ball on the ground, even if it means a few more balls will find holes.
Hitters on the other hand have have their own unique BABIP. When analyzing pitchers, it's generally safe to compare their BABIP to a league average, that is not the case with hitters. For a hitter, you must compare his BABIP to his own, unique, career BABIP. A hitter like Ichiro is going to hit more balls on the ground (better chance for a single) and run out some would be outs into singles, leading to a higher than average BABIP evidenced by his .357 career BABIP. Carlos Pena, who hits significantly more fly balls than most players will therefore have a lower BABIP evidenced by his .279 career mark.
How is this helpful for hitters? Let's use Chone Figgins as an example. Before we do that however, it's important to note that for a player's BABIP to have meaning it must be a large sample size. This is generally true of most outcomes in baseball, but a player should have several seasons worth of data before you start assuming what is "normal" for that player. Back to Chone. Chone has had an awful year in 2010, below his career averages. But, when you look at his BABIP of .317 you realize it's lower than his career BABIP of .337. That doesn't mean we can now simply add on 20 points of average to Chone's 2010 .259 BA, but it does mean that Chone has had some bad luck with his balls put in play this year, and next year he should be closer to his career average in that regard. For more BABIP help, check out this primer.
We've helped fill in some of the holes regarding the pitching story, so let's now try the hitting.
wOBA: Weighted On Base Average:
Again, this stat comes courtesy of Tangotiger or Tom Tango if you want his real name. Similarly to FIP, which is made to "look" like ERA, wOBA is made to "look" like On Base Average. So, when you see wOBA, think OBA. On its own that is pretty meaningless, but since it's scaled to OBA look at it as if ~.335 is average. That means if you see someone who has a wOBA of .286 you figure they aren't too adept at hitting. If they have a .420 wOBA then they should be getting some MVP consideration (provided they can field somewhat, but we'll get there later).
OK, so you now know how to make sense of wOBA, but it would help to understand what it actually does. wOBA attempts to take into account everything a batter can do in one number that people can make sense of. It uses linear weights, providing linear run estimators for all events on a field compared to the run value of an out. Outs (even specifying which type), walks, singles, doubles, triples, homers, stolen bases, caught stealings, it all counts.
You may be asking, doesn't OPS (OBA + SLG) accomplish this? The answer is it doesn't. First of all, OBA and SLG aren't equal in terms of scoring runs, so adding them together doesn't solve its problems. Secondly, Slugging has the run values all wrong, a single isn't worth an arbitrary "1" and a home run an arbitrary "4". As we said, wOBA uses the run values for each event that can happen on a field and you can see those here. They are then all combined into a rate stat and scaled too look like OBA. For more wOBA help, check out this primer.
wOBA bonus: Since wOBA comes from the aggregate total of the run values a player had you can find out how a player did compared to the league average. You takehis wOBA subtract it from the league wOBA and multiplying it by a factor. As the primer above illustrates, that formula is:
wRAA = (player's wOBA - league wOBA) / 1.15wRAA is Weighted Runs Above Average.
Pitching? Check. Hitting? Check. Defense? Let's now talk about that.
DEFENSE:
It would be nice and easy if a players fielding percentage told us a great deal about a fielder's ability but unfortunately it hardly tells us anything. All it does is reflect how many times a player properly handles a ball hit or thrown in his direction. Errors are bad of course but the more important factor to consider with fielding is range. For that we use Mitchel Lichtman's creation, Ultimate Zone Rating.
Ultimate Zone Rating (UZR): This primer explains UZR better than I could but essentially UZR attempts to put a run value on defense. For a super simplistic explanation, the field is broken up into several zones and measures how much above or below average a player is at his position. A number is then calculated that illustrates how many runs above or below that player is compared to an average fielder at his position.
So, maybe Player A makes more errors than Player B but in doing so he covers significantly more ground, turning more hits into outs than Player B. Player A would have a worse fielding percentage, but a much higher UZR making him the better fielder.
While UZR is very useful, the data varies from year to year and it takes several years for the numbers to become significant.
Can we add all of this together and get one perfect stat?
I'm not sure if it's perfect, but the answer is more or less, Yes. That stat is called WAR
Wins Above Replacement (WAR): WAR is the aggregate stat of all the ones we have talked about so far, one number that considers defense, offense, and position. The basis of WAR is comparing a player to a theoretical replacement that any team could find on their Triple-A roster. It's not right to compare to an average player, because a team can't replace an injured starter with an average player but they can call up a Triple-A player from their farm system.
Again, here is a more clear in depth primer on WAR, but here is my short version:
For hitters you add a players wRAA (his hitting component, how many runs above average he is), UZR (fielding component illustrating how many runs above average he is), and a positional adjustment (it's unfair to expect a catcher to hit like a left fielder). Then we convert the numbers to replacement level to get RAR (Runs Above Replacement) Finally, we take that number and convert it to wins where in general, 10 runs equals 1 win.
For pitchers we follow a similar process except we use FIP, which is then converted into runs, adjust for the amount of innings pitched, adjust for replacement level, the run environment and the ball park. Finally, that number is again converted to wins.
EXTRA/MISCELLANEOUS
As you have likely noticed so far, context is extremely important. Comparing a players performance to the league average is a very useful tool. It'd be silly to compare Alex Rodriguez' OPS to Honus Wagner to determine who the better shortstop was, they played in completely different eras. What we can do is compare their OPS+. When you see a stat followed by a '+' that means that stat is scaled compared to the league average where 100 is average, so an OPS+ of 120 means that player's OPS was 20% better than the league average. Alex Rodriguez has a career OPS of .958, 100 points better than Honus Wagner's .858. However, it is Honus Wagner who has a higher career OPS+, 150 compared to 145.
When comparing different eras it is better to compare according to the context they played in rather than the raw numbers. In those cases, using stats like OPS+ and ERA+ (while flawed) are better options.
For more help, check out these very helpful sites:
River Ave Blues Guide to Stats
Hardball Times Glossary
FanGraphs Glossary
FanGraphs UZR Primer
Sabermetric Library